In April of 2009, days from the bottom of the 2nd worst stock decline in the past 100 years, we wrote in this commentary that it was “a good time to invest in stocks due to their bargain prices.” The commentary went on to argue the case that stocks were poised to rally strongly ahead. I got a call from an advisor who was surprised by our message. “As an asset manager who avoided most of the recent losses, shouldn’t you be focused on current risks?” he asked.
I defended our commentary with a simple message: “Our job is to unveil for investors what their emotions aren’t letting them see, not re-enforce their own preconceptions, and currently investors are failing to see that stocks are a screaming buy.” That message, if delivered by advisors at the time, could potentially have added value to investors who heeded their recommendation. From April of 2009 through the end of 2017, stocks were up 303% (2), representing a tripling in value in just over 8 ¾ years.

This wasn’t a brilliant market call. It was simply reverse-thinking the markets. Think about what everyone will typically do in your situation. Then do the opposite. The more compelling the crowd’s behavior, the more compelling the investment case is for doing the opposite of what the crowd is doing. This is a core tenet of our Behavioral Portfolio Design™ philosophy that tries to help guide investors toward better portfolio decisions.
And, there’s good news. The crowd is currently moving in a clear direction that is contrary to market fundamentals, and the case is compelling. How can we reverse-think this?
The Case for Market Overvaluation
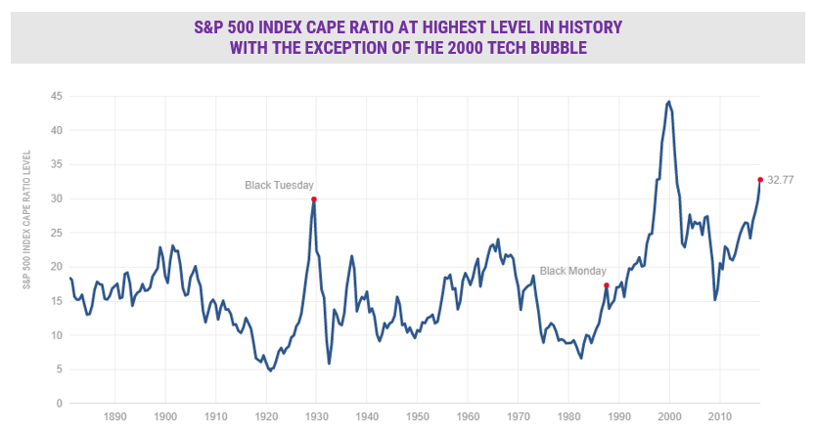
Each quarter we update our “Manage Risk Perceptions” booklet that attempts to gauge market risks relative to those over time. Among the most important measures that we watch are the Price/Earnings ratios of stocks. The ten-year average P/E ratio (Shiller’s CAPE index) on the S&P 500 Index is currently at 32.77 times earnings, higher than at any time other than the internet bubble.

(3)
When the CAPE index has been low, between 5 and 13, gains over the following ten years averaged over 10% per year. However, when the CAPE has been between 20 and 48, as it is now, subsequent ten-year

(4)
returns have been less than 2% per year, representing a significant compression. Furthermore, when losses occur at elevated P/E ratios, they tended to be more extreme. According to asset manager John Hussman of the Hussman Funds, when the CAPE P/E ratio has been in the top quintile, the average 3-year drawdown has been 18%, with a maximum drawdown of 50.9%.

(5)
Targeting Success in an Over-Valued Market
Investors who did the opposite of the crowd and bought near the bottom of the market in 2009 potentially had sizable gains. How can reverse-thinking possibly create this compelling opportunity?
The key is to position portfolios to defend against the momentum of the markets and seize on opportunities presented by the crowd’s poor decision-making ability. That doesn’t mean betting against or selling out of stocks. Instead, it means including strategies like hedged equities or unconstrained tactical strategies that attempt to ride markets higher, but may be un-correlated during declining markets. This seeks to accomplish two goals. First, when stocks turn lower, it acts to potentially lessen portfolio drawdowns. But also, it may create an opportunity to benefit from stock declines by positioning the portfolio to possibly gain during market rebounds. Should that strategy play out, then the uncorrelated portion of the portfolio may realize a net benefit from the market drop.
As markets move further into over-valued territory, the potential size of expected declines may increase, and magnify the effect of owning non-correlated assets. How big has the opportunity been? Let’s look at the worst decline in the past 100 years in the United States — the Great Depression. Investors tend to think of the period between 1929 and 1942 as one dismal economic experience. Instead, it was two severe declines, each followed by fierce market rallies. The heart-stopping decline between 1929 and 1932 of 84% was followed by a rally of 192% over the following five years(6). Markets turned lower again between 1937 and 1941, but then gained 1,114% over the subsequent 14 years(7). Stock declines during the Great Depression caused severe economic losses to many investors. But one could also argue that many investors would never have psychologically persevered and held stocks through these gyrations to realize eventual gains. If a portion of portfolios is poised to potentially benefit from declines, it may cause a psychological shift for investors.

When everyone believes something, and they are mistaken, it can be an opportunity for others. Advisors who adopt a conscious pattern of opposing the crowd stand to distinguish themselves and potentially improve outcomes for their investors.
Disclosure
Prior performance is no guarantee of future results. There can be no assurance, and individuals should not assume, that future performance of any of the portfolios referenced will be comparable to past performance. There can be no assurance that Toews will achieve its performance objectives.
This commentary may include forward-looking statements. All statements other than statements of historical fact are forward-looking statements (including words such as “believe,” “estimate,” “anticipate,” “may,” “will,” “should,” and “expect”). Although we believe that the expectations reflected in such forward-looking statements are reasonable, we can give no assurance that such expectations will prove to be correct. Various factors could cause actual results or performance to differ materially from those discussed in such forward-looking statements.
This commentary is intended to provide general information only and should not be construed as an offer of specifically-tailored individualized advice. Please contact your investment adviser, accountant, and/or attorney for advice appropriate to your specific situation.
This document refers to the performance of the majority of Toews portfolios to illustrate the effect of Toews management on US and intl. stocks and high yield bonds. Performance of individual accounts varied based on the client’s investment risk profile and their specific investment funds. For your individual account performance, please refer to the enclosed quarterly statement or the quarterly statement recently sent to you. In addition, not all model portfolios were referenced in this letter. It is not, nor is it intended to be, a comprehensive accounting of Toews asset management. There are other portfolios that Toews manages that performed differently than what is referenced in this letter. For a complete list of GIPS firm composites, their performance results and their descriptions, as well as additional information regarding policies for calculating and reporting returns, please go to www.toewscorp.com. Toews Corporation acts as the investment advisor that implements the asset allocation and models for each of the portfolios. Investors cannot invest directly in an index.
(1) There is no guarantee that the use of Toews or Toews’ strategies will improve returns.
(2) Source: Morningstar Direct using daily returns for the S&P 500 Index for the period April 1, 2009 to December 29, 2017.
(3) Source: http://www.multpl.com/shiller-pe/. For the period 1/1/1881-1/3/2018. Date accessed: 1-3-2018. Cyclically Adjusted Price/Earnings (CAPE) ratio or otherwise known as Shiller P/E ratio is the Price of the S&P 500 Index divided by the 10-year average earnings. The S&P 500 Index is a market value weighted index and one of the common benchmarks for the U.S. stock market. It is not possible to invest directly in an index.
(4) As of 3/31/15 accessed 8-23-2017, Source: Shiller, GMO, The annualized 10-year forward real returns shown above are calculated using real price, real dividends for the S&P 500 Index, and cyclically adjusted P/E from the standard Shiller data source: http://www.econ.yale.edu/~shiller/data/ie_data.xls for the period 01/01/1940-08/01/2017. Accessed 8/23/2017.The S&P 500 Index is a market value weighted index and one of the common benchmarks for the U.S. stock market. It is not possible to invest directly in an index.
(5) Source: GMO, Hussman Funds, for the period 1/1/1940-12/31/2012. Accessed 8/23/2017. Cyclically Adjusted Price/Earnings (CAPE) ratio or otherwise known as Shiller P/E is the price of the S&P 500 Index divided by the 10-year average earnings. CAPE ratio calculated on January 1 of each year from 1940 to 2012. Annual CAPE ratios were then divided into quintiles. The 3-year average and worst drawdowns were calculated for each quintile.
(6) Source: Global Financial Data using S&P 500 Index yearly returns for the period 12/31/1932 to 12/31/1936. Accessed 1/3/2018.
(7) Source: Global Financial Data using S&P 500 Index yearly returns for the period 12/31/1941 to 12/31/1956. Accessed 1/3/2018.