Inflation has dominated much of the financial news for the past quarter as it has perked up above 4% for the first time in years. This rise is accompanied by many typical attributes of inflationary periods such as supply shortages and surging commodity prices. It’s been a long time since we’ve had any meaningfully high inflation that investors may have little understanding about what the effects on portfolios might be, and even fewer ideas about how to navigate high inflation environments.

We last saw high inflation (which we’re defining as periods when inflation reached double digits in a single year) in the 1970s-1980s. Those of us who are fifty or older recall CD’s paying 13% and oil prices surging. But looking further back there are three examples of high inflation worth noting.

Instead of looking just at individual years of inflation, I’ve found it helpful to look at the cumulative effect of inflation during high inflation periods. Between 1916 and 1919 inflation rose by 83%. Between 1941 and 1948 it increased by 71%. And from 1973 to 1981 inflation surged by 121%. On average, the last three episodes of saw inflation rise by 92% cumulatively, or an almost doubling of prices. That translates to a 47% decrease in purchasing power.
THE SURPRISING EFFECT OF INFLATION ON STOCKS & BONDS
Investors may assume that inflation has a corrosive effect on financial asset prices. That’s a correct assessment. But looking at the playout of these episodes of inflation provides insights and potentially strategies for navigating inflation.
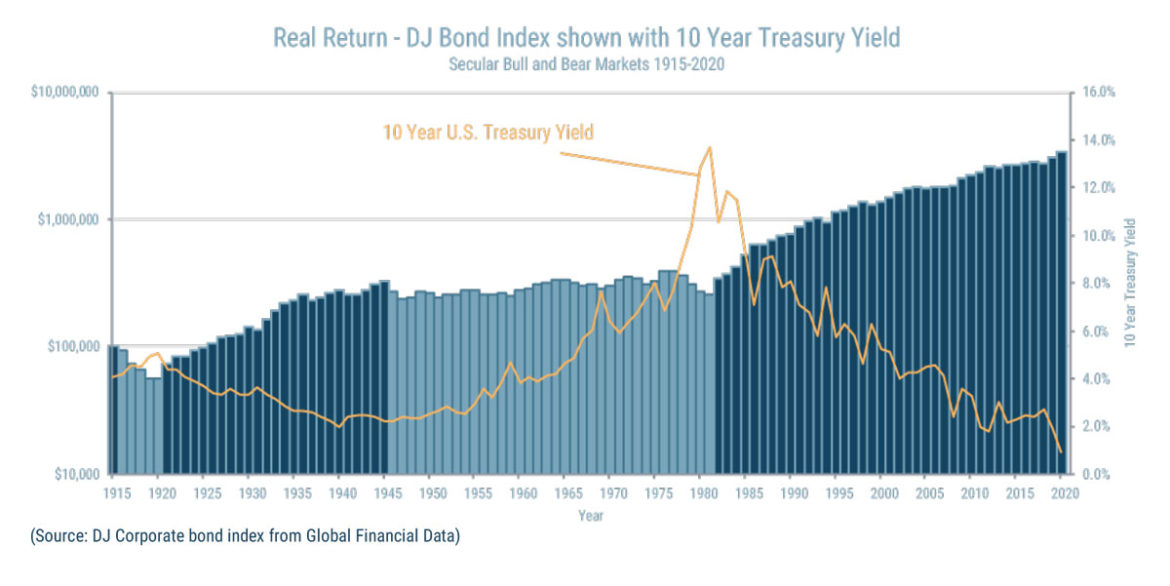
Bonds fared the worst among the two core asset classes. The graphs below illustrate bond real (or after inflation) losses.

Bonds lost 43%, 11%, and 29% over the three inflation periods, averaging losses of 28% (before fees of investing are taken into account). But the most oppressive environment for bonds was made up of parts of the last two inflation episodes. Between 1945 and 1981, bonds experienced real losses of 18% (incorporating inflation between 1945-1948 and 1973 -1981). That’s less than the losses realized during each inflation episode, but the massive duration of that loss, over 36 years, means that some investors potentially realized losses in bonds over their entire investing lifetimes. The figures I’m citing here are all for the Dow Jones Bond Total Return Index. Once costs of bond ownership (funds, advisor fees) are taken into account, total losses over that time could have been far greater.

STOCKS DURING INFLATION
Stocks fared much better during the last three bouts periods of inflation. Between 1919 and 1916 they lost 33% in purchasing power. From 1941 to 1948 they GAINED 28% in real terms, and between 1973 and 1981 they again lost 29% in real terms. On average, they lost only 11% of purchasing power during the last three episodes of inflation.

Stocks superior real returns during times of high inflation may have been because as prices rise, companies are able to pass through some or all of those increases in the form of higher prices, which may pass through to higher revenue and profits. That natural response as a pass through for inflation may have been the cause for stocks superior performance.
However, it’s worth looking at the pattern of how those losses played out. In EACH of the instances of high inflation, stocks declined prior to or during the initial years of inflation, but then moved higher, and in some cases rallied strongly. Perhaps a good time period to look back to as a parallel was inflation that began in 1973. Stocks began highly valued, as they are now, and fell over 48%, but then rallied through much of the following years.
STRATEGIES FOR ADDRESSING HIGH INFLATION IN PORTFOLIO CONSTRUCTION.
We believe that the strategy for addressing the contingency of inflation is found in looking at market history:
- Maintain Exposure to the Stock Market to Take Advantage of its Potential Ability to Increase along with Inflation.
- Hedge Stock Portfolios in an Attempt to Address Stock Decreases during times of Over-Valuation.
- Move Fixed Income Portfolios into Adaptive or Unconstrained Funds that Attempt to Mitigate the Effect of Rising Rates or Inflation.
By maintaining adequate exposure to stocks, investors can potentially navigate periods of high inflation due to stocks innate and potentially positive response to rising prices. By hedging portfolios against market declines, investors can attempt to address high valuations and the reality that each period of high inflation over the past century saw stocks fall during the initial years of rising prices. Finally, but choosing adaptive/unconstrained fixed income funds and strategies, investors can attempt to mitigate the effect of rising interest rates and inflation.
Our approach to tackling inflation is illustrated in what we refer to as behavioral portfolios (See Figure Below). This portfolio holds common 60/40 allocations to stocks, but places half of those stocks into risk managed, hedged equity funds or strategies. It places fixed income portfolios into adaptive fixed income strategies that may move to short duration bonds or TIPS if bonds turn lower.

TO ADDRESS INFLATION, THINKING UNCONVENTIONALLY MAY BE THE BEST PATH FORWARD
It’s unknown whether inflation will remain high, move even higher, or be a transitory phenomenon. What we do know is that inflation has been declared dead many times in the past but has had a way of coming back to life. We also know that inflation has risen meaningfully recently, that economies are surging higher due to re-openings and easy money stimulus from the Government’s fiscal and monetary policies. Finally, interest rates remain near historic lows and threaten to move higher at the same time that stocks are valued in their top quintile of historic values. That means that both core asset classes are threatened.
Our approach is to avoid making an outright call that inflation will increase, or that stocks will decrease, but to address the possibility that either will happen in the way that you position portfolios. By maintaining a conventional allocation between stocks and bonds, but choosing adaptive strategies, investors may be able to persevere or even prosper regardless of inflations path ahead.
Disclosure
Prior performance is no guarantee of future results. There can be no assurance, and individuals should not assume, that future performance of any of the portfolios referenced will be comparable to past performance. There can be no assurance that Toews will achieve its performance objectives.
This commentary may include forward-looking statements. All statements other than statements of historical fact are forward-looking statements (including words such as “believe,” “estimate,” “anticipate,” “may,” “will,” “should,” and “expect”). Although we believe that the expectations reflected in such forward-looking statements are reasonable, we can give no assurance that such expectations will prove to be correct. Various factors could cause actual results or performance to differ materially from those discussed in such forward-looking statements.
This commentary is intended to provide general information only and should not be construed as an offer of specifically-tailored individualized advice. Please contact your investment adviser, accountant, and/or attorney for advice appropriate to your specific situation.
The charts above represent the hypothetical growth $100,000 if it were possible to invest directly into the relevant indices. Investors cannot invest directly in an index. The real return is the nominal rate of return adjusted for inflation. A total return index is an index that tracks both the capital gains of a group of stocks over time, and assumes that any cash distributions, such has dividends and interest, are reinvested back into the index. Real Losses and Maximum Draw-Down are calculated using total return of the Dow Jones Corporate Bond Index and account for inflation. The Dow Jones Corporate Bond Index is an unmanaged index generally representative of the U.S. bond market.
The S&P 500 Index (S&P) is one of the world’s most recognized indexes by investors and the investment industry for the equity market. The S&P, however, is not a managed portfolio and is not subject to advisory fees or trading costs. Investors cannot invest directly in the S&P 500 Index. The S&P returns also reflect the reinvestment of dividends. Clients or prospective clients should be aware that the referenced benchmark funds may have a different composition, volatility, risk, investment philosophy, holding times, and/or other investment-related factors that may affect the benchmark funds’ ultimate performance results. Therefore, an investor’s individual results may vary significantly from the benchmark’s performance. Investors cannot invest directly in an index.
For additional information about Toews, including fees and services, send for our disclosure statement as set forth on Form ADV by contacting Toews at Toews Corporation, 1750 Zion Road, Suite 201, Northfield, NJ 08225-1844 or (877) 863-9726.