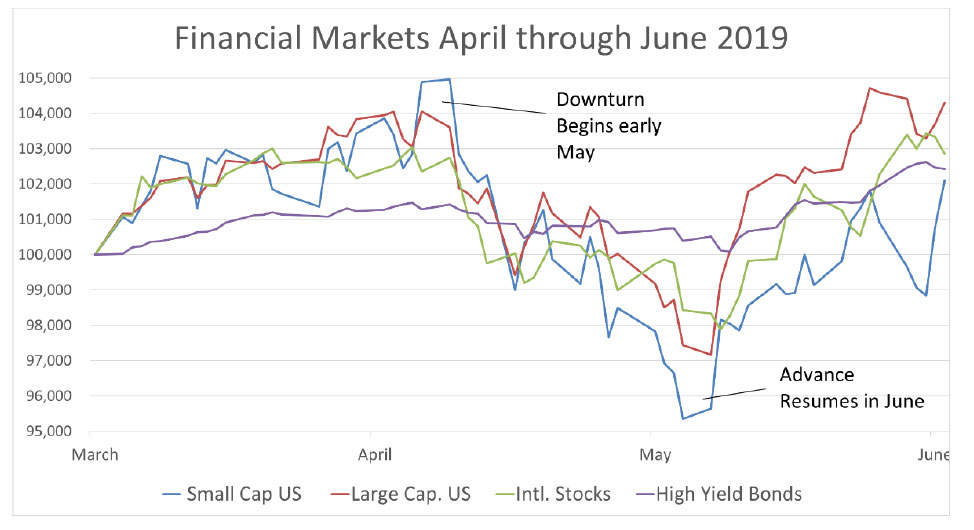
The second quarter began with gains following a strong first quarter. Markets turned lower in May in response to deteriorating economic indicators and rising interest rates. Our strategies became defensivei in response to our algorithms while the S&P 500 Index fell as much as 7% into the end of May.ii In June, as messaging from the Federal Reserve (Fed) indicated that rates may be lowered, markets resumed their advance. Our algorithms indicated a positive market trend and caused us to re-enter asset classes in early to mid-June.

iii
We finished the quarter in a fully invested position. The first half of the year saw gains across virtually every asset class including US and International Stocks and Bonds.
Our Views for the Second Half
Investors seem to be focused on perceptions of further Fed rate changes and news about US-China tariff negotiations. A simplistic analysis of interest rates and tariff negotiations might suggest that:
If the Fed lowers rates and the trade dispute with China is resolved, markets could advance.
If rates are not lowered and/or the China dispute worsens, markets may fall.
This analysis, however, ignores underlying negative indicators that have and are continuing to suggest that, despite favorable outcomes on trade and rates, the economy may still be headed for a recession.
First, Fed easing has not been always been effective at defending against declining markets in the past. The Fed began lowering rates in the very beginning of both the 2000-2002 and the 2007-2009 declines, yet these moves were followed by significant losses in stocks.
On the US-China Trade dispute, markets rallied on July 1 after Trump and China’s president agreed to pause further escalation of tariffs at the G-20 meeting. However, the potency of this pause may be limited. The last time that the two reached a similar agreement at the G-20 in Argentina last December, the rally lasted exactly one day and was followed by the worst December on record.
Historically, one of the most reliable recession indicators has been a treasury bond yield curve inversion. This occurs when the rates for longer term bonds provide lower yields than shorter duration bonds. As of this week, the yield curve has been inverted for a full quarter. The yield curve has been inverted before each of the past seven recessions, without producing a single false signal over the past fifty years.iv

v
Other indicators such as some weak job reports (other than the June and July reports) during the quarter and a softening Purchasing Managers Index advance the case that a recession may be in the cards.
What’s important for our investors to understand is that the global economy is like a massive ship that changes direction very slowly. Many of the factors that will determine the path of the markets, including already over-valued stocks and negative sentiment around tariffs and supply chain disruptions, have already set in motion the seeds of a potential recession regardless of individual headlines about tariffs or interest rates.
The History of Smoot-Hawley Trade War
Over the past year we’ve often focused on the global trade conflict. The reason is that trade wars may have contributed to some of our most significant market declines. For decades, both parties in the U.S. avoided implementing tariffs, preferring to resolve conflicts through the World Trade Organization. The last time that the U.S. implemented significant tariffs was in 1929 and 1930. Although it’s hard to make a causal connection between tariffs and stock prices, the dates that trade legislation passed the House was prior to the beginning of the stock market crash that helped lead to the Great Depression.

Markets initially fell in May of 1929 shortly before the House first passed the Smoot-Hawley bill, introducing the strong possibility that tariffs would be enacted on farm goods. However, it wasn’t until later that year, on October 21, when the Senate added tariffs to non-farm imports, that markets turned decidedly negative. That following Thursday has come to be known as Black Thursday and was followed by the stock market crash on the 28th and 29th of October.
In June of the following year, President Hoover signed the legislation into law. From the peak of the markets in October of 1929 to the bottom in May of 1932 the S&P 500 Index fell a total of 86%.
It’s difficult to ascertain the impact of ongoing trade negotiations, but most will agree that the stakes are high. As we’ve shared numerous times in previous commentaries, Toews strategies were explicitly built to attempt to address the possibility for market downturns. Our strategies attempt to become defensive during the early stages of declines, before significant losses mount. Furthermore, if markets drop significantly, and remain lower for several months, our strategies can potentially repurchase assets at bargain prices to participate in subsequent rebounds. That changes the psychology and results of market drops. Instead of fearing stock market turmoil, investors can view it as an opportunity. The greater the losses, the greater the chances for gains at the conclusion of the decline.
By building in a process for attempting to reduce losses, and creating a plan in advance of market turmoil, we hope that this helps you understand that Toews strategies are designed for multiple market cycles.
Disclosure
Prior performance is no guarantee of future results. There can be no assurance, and individuals should not assume, that future performance of any of the portfolios referenced will be comparable to past performance. There can be no assurance that Toews will achieve its performance objectives.
This commentary may include forward-looking statements. All statements other than statements of historical fact are forward-looking statements (including words such as “believe,” “estimate,” “anticipate,” “may,” “will,” “should,” and “expect”). Although we believe that the expectations reflected in such forward-looking statements are reasonable, we can give no assurance that such expectations will prove to be correct. Various factors could cause actual results or performance to differ materially from those discussed in such forward-looking statements.
This commentary is intended to provide general information only and should not be construed as an offer of specifically-tailored individualized advice. Please contact your investment adviser, accountant, and/or attorney for advice appropriate to your specific situation.
This document refers to the performance of the majority of Toews portfolios to illustrate the effect of Toews management on US and intl. stocks and high yield bonds. Performance of individual accounts varied based on the client’s investment risk profile and their specific investment funds. For your individual account performance, please refer to the enclosed quarterly statement or the quarterly statement recently sent to you. In addition, not all model portfolios were referenced in this letter. It is not, nor is it intended to be, a comprehensive accounting of Toews asset management. There are other portfolios that Toews manages that performed differently than what is referenced in this letter. For a complete list of GIPS firm composites, their performance results and their descriptions, as well as additional information regarding policies for calculating and reporting returns, please go to www.toewscorp.com. Toews Corporation acts as the investment advisor that implements the asset allocation and models for each of the portfolios. Investors cannot invest directly in an index.
For additional information about Toews, including fees and services, send for our disclosure statement as set forth on Form ADV by contacting Toews at Toews Corporation, 1750 Zion Road, Suite 201, Northfield, NJ 08225-1844 or (877) 863-9726.
(i) Not all asset classes in all strategies may have become defensive, and some strategies may have asset classes that move at different times than other strategies.
(ii) Toews strategies also realized losses before, during and/or after the indicated time period. When Toews strategies become defensive, they may not necessarily be 100% defensive and, even if they are, there is still a possibility of loss in the strategies. Toews will provide a list of all recommendations for the last 12 months upon request.
(iii) Small Cap US refers to the Russell 2000 Index. Large Cap US refers to the S&P 500 Index. Intl. Stocks refers to the MSCI EAFE Index. High Yield Bonds refers to the ICE Bank of America Merrill Lynch US Cash Pay High Yield Index
(iv) Source: https://www.cnbc.com/2019/03/25/the-us-bond-yield-curve-has-inverted-heres-what-it-means.html; Date Accessed 7-9-2019
(v) As of 7-3-2019. Source: https://www.treasury.gov/resource-center/data-chart-center/interest-rates/Pages/TextView.aspx?data=yield; Date Accessed 7-5-2019