Nothing gratifies investment managers or their investors like a climbing stock market. And the stock market did just that in the first quarter of this year. The S&P 500 Index increased 6% over the past three months, building on post-election gains last year. Other indices also gained, with the small cap index trailing the large cap index. The Russell 2000 small cap index gained 2.5%, while the international MSCI EAFE index gained 7.25%i.

S&P 500 Index Price and Earnings Per Shareii
Unfortunately, bull markets don’t occur in a vacuum. Ultimately stock earnings need to grow along with the market in order to support elevated prices. Yet, over the past three years, reported earnings for the S&P 500 Index have actually declined 5% while the S&P 500 Index has increased 34% including dividendsiii. Earnings are expected to increase for the first quarter of this year. However, the increase in prices absent earnings has caused the Price/Earnings ratio of the index to be at historically elevated levels. The closely watched Shiller (CAPE) price/earnings index is now higher than at any point except 1929 and 2000 (see below chart). iv

This doesn’t mean that we’re predicting a stock market decline. However, it does mean that the prospect for additional gains is lower than it would be if stocks were priced more reasonably. It also indicates that the probability of a decline ahead is high. Best thing: Markets are higher. Worst thing: Watch out ahead!
Making Portfolio Risks Make Sense
The investment industry, like every other business, has its own way of thinking about risk. It’s not uncommon for investment professionals to build portfolios that have a 90% or 95% probability of success. That means that portfolios are built so that in only 1 in 10, or 1 in 20 times historically would an investor run out of money based on their needs. These probabilities, however, are at odds with how we view risks in other aspects of our lives.
If you are currently in your 30’s, you may feel like you’re immortal, and you practically are. There’s a 92% probability (depending on your gender) that you’ll live to be 60v. Yet, if you’re also the primary income source in a family with children, it would be considered irresponsible to not have a sizable life insurance policy to protect your family during those early years. Other examples are starker. Are you always exiting the pool during a thunderstorm? Your chances of being struck by lightning during your lifetime are 1 in 3,000vi. Nervous during take-off and landing? The odds of that plane going down are 1 in 5.3 millionvii.
Our view is that a 1 in 10 chance of running out of money is an unacceptable risk for an investor to take. When markets enter declines, investors have no idea if it is a routine correction, or the beginning of a significant pull back. So, in addition to the real risk of damage to portfolios, investors have little peace of mind as markets cycle through losses and gains.
Preparing Portfolios for Turbulent Markets
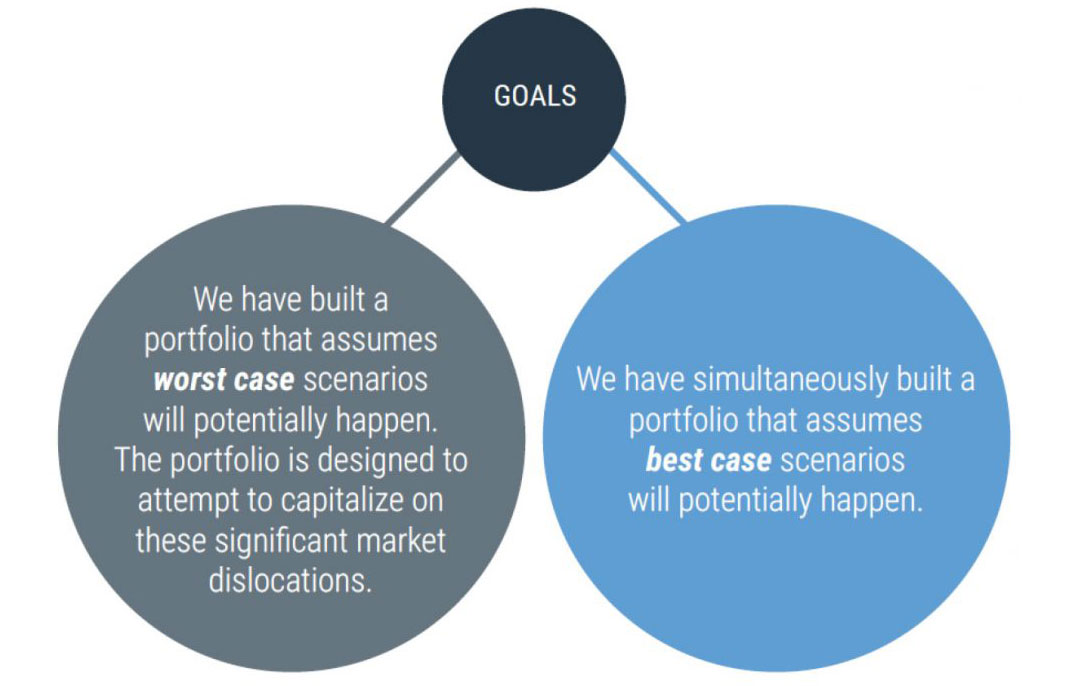
The desire to help mitigate the risk of significant losses was behind the conception of our strategies over twenty years ago. Our goal is to build strategies that assume that worst cast scenarios will potentially happen, and attempt to capitalize on significant market dislocations. At the same time, we assume that best case scenarios will potentially occur, and position the portfolio to attempt to capture a portion of market gains. The path to navigate these markets and possible significant declines is straightforward but requires constant vigilance: 1) stay committed to equity markets, historically the best performing asset class to help protect against inflation and 2) hedge your portfolios against losses. Both are pillars on which the Toews system is built.

Disclosure
Prior performance is no guarantee of future results. There can be no assurance, and individuals should not assume, that future performance of any of the portfolios referenced will be comparable to past performance. There can be no assurance that Toews will achieve its performance objectives.
This commentary may include forward-looking statements. All statements other than statements of historical fact are forward-looking statements (including words such as “believe,” “estimate,” “anticipate,” “may,” “will,” “should,” and “expect”). Although we believe that the expectations reflected in such forward-looking statements are reasonable, we can give no assurance that such expectations will prove to be correct. Various factors could cause actual results or performance to differ materially from those discussed in such forward-looking statements.
This commentary is intended to provide general information only and should not be construed as an offer of specifically-tailored individualized advice. Please contact your investment adviser, accountant, and/or attorney for advice appropriate to your specific situation.
This document refers to the performance of the majority of Toews portfolios to illustrate the effect of Toews management on US and intl. stocks and high yield bonds. Performance of individual accounts varied based on the client’s investment risk profile and their specific investment funds. For your individual account performance, please refer to the enclosed quarterly statement or the quarterly statement recently sent to you. In addition, not all model portfolios were referenced in this letter. It is not, nor is it intended to be, a comprehensive accounting of Toews asset management. There are other portfolios that Toews manages that performed differently than what is referenced in this letter. For a complete list of GIPS firm composites, their performance results and their descriptions, as well as additional information regarding policies for calculating and reporting returns, please go to www.toewscorp.com. Toews Corporation acts as the investment advisor that implements the asset allocation and models for each of the portfolios. Investors cannot invest directly in an index.
(i) Source: Morningstar.com
(ii) Source: http://www.macrotrends.net/1324/s-p-500-earnings-history
(iii) Source: Bloomberg for the period from 3-31-2014 through 3-31-2017
(iv) Source: http://www.multpl.com/shiller-pe/ Price earnings ratio is based on average inflation-adjusted earnings from the previous 10 years, known as the Cyclically Adjusted PE Ratio (CAPE)
(v) Source: Social Security Adminstration
(vi) http://news.nationalgeographic.com/news/2004/06/0623_040623_lightningfacts.htm
(vii) http://www.economist.com/blogs/gulliver/2015/01/air-safety