Recent market turmoil followed by gains left some investors confused about where to go from here. Buying into risk assets after significant drops is never easy. The ability to move against intuition remains a critically important characteristic of our investment philosophy at Toews.
High Yield Bonds Show Elevated Return Potential
Returns in high yield bond models are primarily made up of two components: yield and potential price appreciation. Currently, high yield bonds are yielding 7.46%[i], representing a spread of 7.06%[ii]. This yield alone represents a potentially significant improvement over the yields in investment grade bonds.
However, the second component, price appreciation, may represent the more compelling opportunity for investors. In 2008, when high yield bonds dropped over 25%, it set them up for their best return year in generations.
Although we own high yield bonds and may exit if high yield bonds turn lower, we’re less concerned about any one trade than we are optimistic about this asset class given the increase in the yield spread.
By comparison, the 10 year treasury note is yielding .66%[iii]. These low returns remain vulnerable to rising interest rates off of lows not seen at any time in history. Prior to the downturn this quarter, the 10 year treasury note had never yielded less than 1%.
US and International Stocks May Still be Highly Vulnerable to Declines
Do you remember the rally in early February when the S&P 500 Index set an all time high, even after COVID-19 had begun to spread across the globe? We view that rally as the most resonant data point to consider when thinking about the current rally.
Investors have a difficult time taking qualitative information (vaccine testing beginning) and translating that into investment decisions whose wisdom will ultimately be determined by a quantitative outcome (do earnings justify valuations?).
Some simple calculations help expose the continued vulnerability of the stocks. Let’s start with a simple question:
GDP Growth=Stock Market Advances?
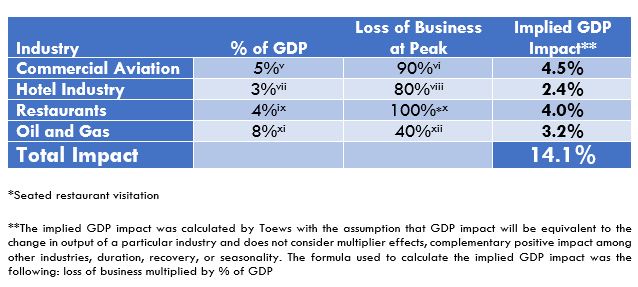
At the beginning of the year, projections for US GDP growth were near 2%[iv]. What will the impact of COVID be on GDP growth for the foreseeable future? Looking at the contraction in operations of key industries at the peak of the crisis helps illuminate the challenges:

Without even considering retail or the impact on spending of layoffs across the country, the potential reduction in GDP from just these four industries is an enormous 14.1%.
As states re-open, business will surely improve from the peak of the crisis. But how much? S&P 500 companies operated with a 10.7% profit margin for 4Q 2019[xiii]. Returning to 50% of normal operations for most industries may be an improvement over a 90% contraction, but it is consistent with huge operating losses, not profits.
Conclusion:
GDP Contraction of 14% May Not Equal Stock Market Advances
In other words, we feel good about vaccine news, but stocks are probably going to be punished. If your long-term plans don’t include a permanent impairment of capital, do contingency planning that brings the quantitative and qualitative back in sync.
The point is not to bet against the market. It is to attempt to lessen exposure to extreme losses, but attempt to participate if markets move higher. The window for contingency planning may be fleeting. View this market rally as a potential opportunity. It’s a rarely received second chance to make your practice one which could help offset losses during a crisis.
Disclosure
Prior performance is no guarantee of future results. There can be no assurance, and individuals should not assume, that future performance of any of the portfolios referenced will be comparable to past performance. There can be no assurance that Toews will achieve its performance objectives.
This message may include forward-looking statements. All statements other than statements of historical fact are forward-looking statements (including words such as “believe,” “estimate,” “anticipate,” “may,” “will,” “should,” and “expect”). Although we believe that the expectations reflected in such forward-looking statements are reasonable, we can give no assurance that such expectations will prove to be correct. Various factors could cause actual results or performance to differ materially from those discussed in such forward-looking statements.
This message is intended to provide general information only and should not be construed as an offer of specifically-tailored individualized advice. Please contact your investment adviser, accountant, and/or attorney for advice appropriate to your specific situation. This document refers to the performance of the majority of Toews portfolios to illustrate the effect of Toews management on US and intl. stocks and high yield bonds. Performance of individual accounts varied based on the client’s investment risk profile and their specific investment funds. For your individual account performance, please refer to the enclosed quarterly statement or the quarterly statement recently sent to you. In addition, not all model portfolios were referenced in this letter. It is not, nor is it intended to be, a comprehensive accounting of Toews asset management. There are other portfolios that Toews manages that performed differently than what is referenced in this letter. For a complete list of GIPS firm composites, their performance results and their descriptions, as well as additional information regarding policies for calculating and reporting returns, please go to www.toewscorp.com. Toews Corporation acts as the investment advisor that implements the asset allocation and models for each of the portfolios. Investors cannot invest directly in an index.
Definitions:
High-yield bonds, or “junk” bonds are corporate debt securities that pay higher interest rates because they have lower credit ratings than investment-grade bonds. Yield is the rate earned by a bond holder.
The 10-year Treasury note is a debt obligation issued by the United States government with a maturity of 10 years upon initial issuance.
The S&P 500 Index is a market-capitalization-weighted index of the 500 largest U.S. publicly traded companies.
Gross Domestic Product (GDP) is the monetary value of all finished goods and services made within a country during a specific period. GDP provides an economic snapshot of a country, used to estimate the size of an economy and growth rate.
For additional information about Toews, including fees and services, send for our disclosure statement as set forth on Form ADV by contacting Toews at Toews Corporation, 1750 Zion Road, Suite 201, Northfield, NJ 08225-1844 or (877) 863-9726.
1794389/052720 MK
[i] Source of Data: Ice Data Indices, LLC, ICE BofA US High Yield Index Effective Yield [BAMLH0A0HYM2EY], retrieved from FRED, Federal Reserve Bank of St. Louis; https://fred.stlouisfed.org/series/BAMLH0A0HYM2EY, May 26, 2020.
[ii] Source of Data: Ice Data Indices, LLC, ICE BofA US High Yield Index Option-Adjusted Spread [BAMLH0A0HYM2], retrieved from FRED, Federal Reserve Bank of St. Louis; https://fred.stlouisfed.org/series/BAMLH0A0HYM2, May 26, 2020.
[iii] Source of data: https://www.treasury.gov/resource-center/data-chart-center/interest-rates/pages/textview.aspx?data=yield – Date accessed 5-26-2020
[iv] Source of Data: https://www.thebalance.com/us-economic-outlook-3305669 Date Accessed 5-26-2020
[v]Source of Data: https://www.airlines.org/data/ Date Accessed 5-26-2020
[vi] Source of Data: https://www.airlines.org/dataset/impact-of-covid19-data-updates/# Date Accessed 5-26-2020
[vii] Source of Data: https://www.ahla.com/press-release/hotel-industry-supports-more-1-25-american-jobs Date Accessed 5-26-2020
[viii] Source of Data: https://www.ahla.com/covid-19s-impact-hotel-industry Date Accessed 5-26-2020
[ix] Source of Data: https://marketrealist.com/2019/09/the-restaurant-industry-an-overview/ Date Accessed 5-26-2020
[x][x] Source of Data: https://www.statista.com/statistics/1103928/coronavirus-restaurant-visitation-impact/ Date Accessed 5-26-2020
[xi] Source of Data: https://www.api.org/news-policy-and-issues/taxes/oil-and-natural-gas-contribution-to-us-economy-fact-sheet Date Accessed 5-26-2020
[xii] Source of Data: Refinitiv. https://www.cnbc.com/2020/04/30/coronavirus-creating-1-trillion-revenue-loss-for-oil-and-gas-companies.html Date Accessed 5-26-2020
[xiii] Source of Data: Refinitiv. https://www.cnbc.com/2020/04/30/coronavirus-creating-1-trillion-revenue-loss-for-oil-and-gas-companies.html Date Accessed 5-26-2020